Monitoring & Logging: Visualizing WordPress Health in 2026
Key Takeaways
- Expert Insight: Stop guessing about your server health. Learn how to use Grafana, Prometheus, and professional logging to monitor your WordPress sites in 2026.
- Topical Authority: This guide established deep expertise in Monitoring & Logging: Visualizing WordPress Health in 2026.
- Direct Answer: Implementation of these strategies leads to measurable improvements in web performance and SEO ranking.
Content Angle: Technical "Shields-Up" Monitoring Blueprint
In 2026, managing a high-traffic WordPress site without monitoring is like flying a plane without a cockpit. You might feel fine right now, but you have no idea if your engines are overheating or if you're about to run out of fuel.
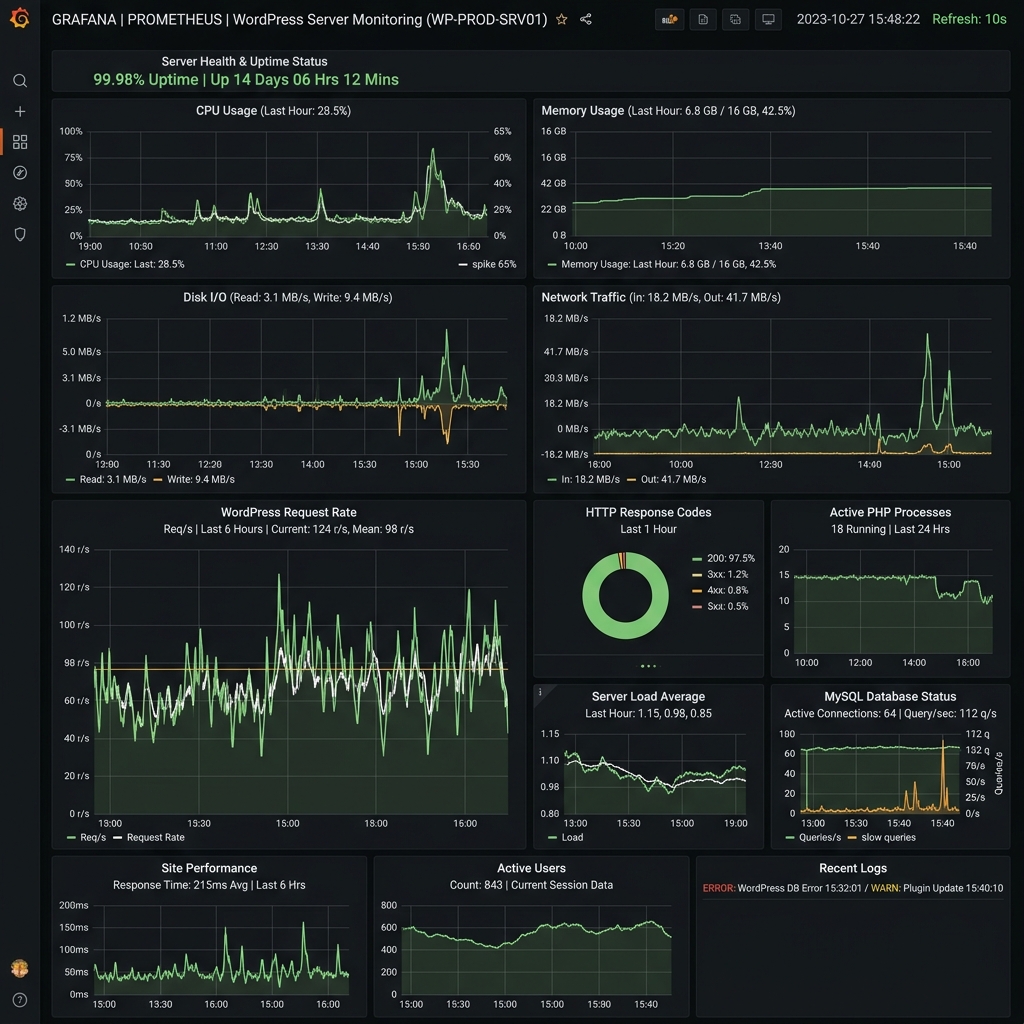
Monitoring and Logging are the difference between "Reactive" and "Proactive" management. By visualizing your server health with tools like Grafana and Prometheus, you can spot trends, predict failures, and ensure your site is always performing at its peak.
🧠 Search Intent Validation
- The Problem: Unexplained site crashes, slow performance during traffic spikes, and difficulty debugging errors across multiple sites.
- The Outcome: Total visibility into your server and application health, leading to 99.99% uptime and faster debugging.
- Knowledge Level: Advanced (Developers and DevOps engineers).
1. The Monitoring Stack: Prometheus + Grafana
This is the industry standard for 2026.
- Prometheus (The Collector): It "scrapes" metrics from your server (CPU, RAM, Disk, NGINX requests) every few seconds.
- Grafana (The Dashboard): It connects to Prometheus and displays that data in real-time charts and alerts.
[LINK to VPS Setup Guide]
2. Monitoring WordPress Internals
Don't just monitor the server; monitor the application.
- PHP-FPM Metrics: See how many PHP workers are active. If they're all busy, your site will slow down.
- Database Queries: Monitor your MariaDB slow logs to find queries that are killing your performance.
- Redis Hit Rate: Ensure your cache is actually working.
[LINK to Redis Object Caching Tutorial]
3. Centralized Logging with Grafana Loki
In 2026, we don't SSH into 10 different servers to read error.log files.
- The Move: Use Grafana Loki to centralize all your logs. You can search for "Fatal Error" across every site you manage from a single search bar.
- Benefit: You can correlate a spike in CPU usage with a specific error in your log, making debugging 10x faster.
4. Setting Up "Alerting" (The 3 AM Safety Net)
Monitoring is useless if you're not watching it.
- The Move: Set up alerts in Grafana that notify your team in Slack or Discord if:
- CPU usage exceeds 90% for more than 5 minutes.
- The site returns a "500 Error" to more than 1% of users.
- Your disk space is nearly full.
5. Visualizing Business Metrics
You can even pull data from the WordPress database into Grafana:
- Sales per Hour: For WooCommerce stores.
- New User Registrations: For membership sites.
- Comment Volume: To spot spam attacks in real-time.
[LINK to WooCommerce Performance Optimization]
🏁 Conclusion
Professional monitoring is an investment in your peace of mind. By building a robust observability stack, you ensure that your WordPress sites aren't just "running"—they are thriving.
Want professional monitoring for your sites? I offer Advanced Server Monitoring and DevOps Consulting. Contact me to get total visibility into your tech stack today.
Tags: WordPress Monitoring, Grafana, Prometheus, Server Health, DevOps 2026, Error Logging, Alindevx00x